An Advertising Campaign Marketing Report helps you understand how your advertising campaign is performing. It brings important data into one clear document. You can track reach, clicks, conversions, spending, and return on investment.
A good report does more than show numbers. It explains what those numbers mean. It also helps you find opportunities to improve your next campaign.
Whether you use Google Ads, social media ads, display ads, or email marketing, a clear report can save time. More importantly, it can help you make better marketing decisions.
What Is an Advertising Campaign Marketing Report?
An advertising campaign marketing report is a document that summarizes campaign performance. It covers a specific time period. It also connects campaign results with your original marketing goals.
For example, a brand awareness campaign may focus on reach and impressions. In contrast, a sales campaign may focus on conversions and revenue.
A typical report can include:
- Campaign goals and objectives
- Target audience details
- Advertising channels
- Campaign budget
- Reach and impressions
- Clicks and click-through rate
- Leads and conversions
- Cost per click
- Cost per acquisition
- Return on investment
- Key campaign findings
- Recommendations and next steps
Why Do You Need a Marketing Campaign Report?
Advertising campaigns can generate a large amount of data. As a result, it can be difficult to see the full picture.
A marketing campaign report solves this problem. It organizes important information in one place. Therefore, your team can review campaign performance faster.
Measure Campaign Performance
First, a report shows whether your campaign reached its goals. You can compare actual results with your original targets.
For example, you may set a goal of 10,000 website visits. Your report can show whether the campaign reached that target.
Track Advertising Costs
Next, the report helps you track spending. You can compare your planned budget with your actual advertising costs.
This comparison can reveal overspending or unused budget. It can also help you plan future campaigns.
Find Strong Marketing Channels
Modern campaigns often use several channels. These may include search engines, social media, email, and display advertising.
A report lets you compare those channels. You can see which ones generate clicks, leads, sales, or other valuable actions.
Improve Future Campaigns
Finally, your report can guide future marketing work. You can use campaign data to test new ideas and improve your strategy.
Tip: Connect every recommendation to a specific campaign result. This makes your report more useful and easier to understand.
Important Advertising Campaign Metrics
The best metrics depend on your campaign goal. However, several metrics are useful for most advertising campaigns.
Reach and Impressions
Reach shows how many unique people saw your advertisement. Impressions show how many times your advertisement appeared.
These metrics are useful for awareness campaigns. They help you understand the size of your advertising exposure.
However, high reach does not always mean high campaign value. You should also check engagement and conversion results.
Click-Through Rate
Click-through rate (CTR) shows how often people click after seeing an advertisement.
A strong CTR may indicate that your ad message is relevant to the audience. However, CTR should not stand alone.
For example, an advertisement may generate many clicks but very few sales. Therefore, you should compare CTR with conversion data.
Conversions
A conversion is a valuable action completed by a user. The action depends on your campaign goal.
A conversion could be a purchase, form submission, registration, phone call, or download.
Conversion tracking helps you understand whether your advertising traffic produces useful business results.
Cost Per Click
Cost per click (CPC) shows the average amount spent for each advertising click.
This metric can help you understand traffic costs. You can also compare CPC across different campaigns, audiences, or advertising channels.
Cost Per Acquisition
Cost per acquisition (CPA) shows the average cost of generating a conversion.
CPA is especially useful for lead generation and sales campaigns. A lower CPA can reduce acquisition costs, but you should also consider lead or customer quality.
Return on Investment
Return on investment (ROI) connects advertising costs with the value generated by a campaign.
When reliable revenue data is available, ROI can provide a useful view of campaign efficiency. Always define which costs and revenue sources you include in the calculation.
How to Create an Advertising Campaign Marketing Report
Creating a useful report does not need to be complicated. A simple structure can make your report easier to read and update.
1. Add Basic Campaign Information
Start with the campaign name and reporting period. Then, add the campaign objective and target audience.
You can also include the campaign budget, marketing channels, and team responsible for the campaign.
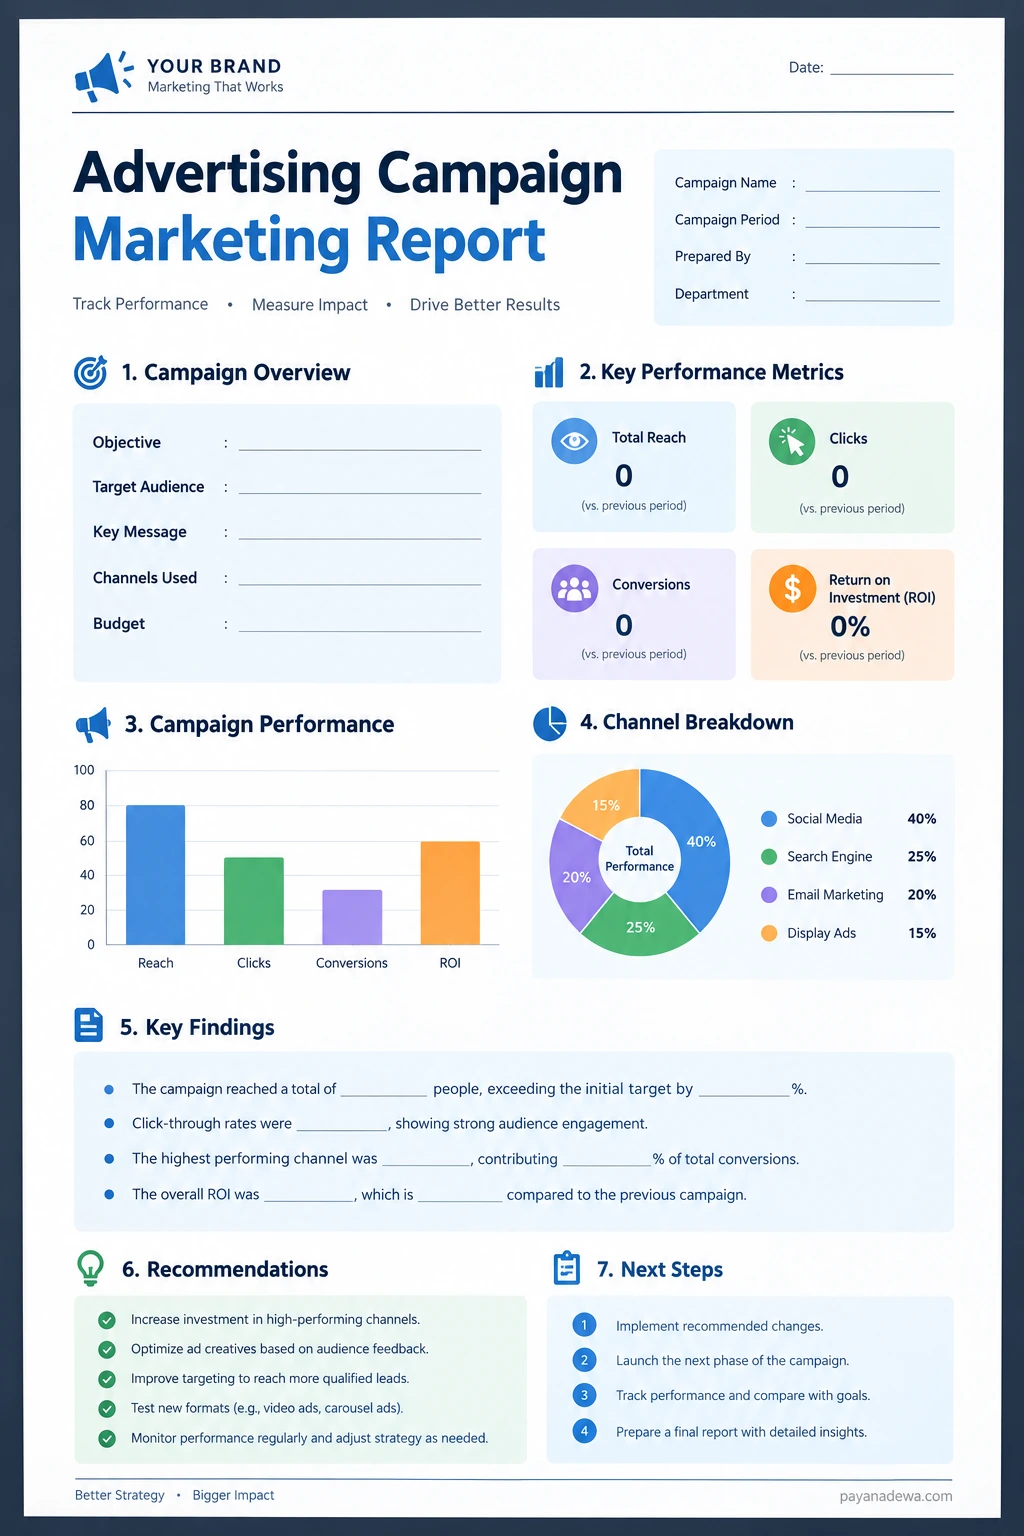
2. Create a Performance Summary
Next, highlight the most important numbers. Keep this section short and easy to scan.
Useful summary metrics may include:
- Total reach
- Total impressions
- Total clicks
- Click-through rate
- Total conversions
- Advertising spend
- Cost per acquisition
- Revenue
- Return on investment
3. Compare Advertising Channels
After the summary, break down results by channel. This approach gives you more detail.
For example, you may compare social media, search advertising, email marketing, and display advertising.
Look at several metrics for each channel. A channel with many clicks may still produce fewer conversions. Therefore, avoid judging performance from one metric alone.
4. Explain the Key Findings
Numbers need context. For this reason, include a short explanation of your most important findings.
You could explain which channel generated the most conversions. You could also identify an audience segment with strong engagement.
Keep each finding clear. Then, explain why it matters to the campaign.
5. Add Actionable Recommendations
Finally, turn your findings into practical recommendations.
For example, you may recommend testing new ad designs. You may also suggest improving audience targeting or adjusting campaign spending.
Good recommendations should be specific. They should also connect directly to your campaign data.
For a simple visual example, use the printable template below.
How to Analyze Campaign Performance
Once you create the report, you need to analyze the results. A simple process can help you find useful insights.
Compare Results With Your Goals
Start by comparing your results with your campaign goals.
If your goal is brand awareness, review reach and impressions. If your goal is lead generation, review leads, conversions, and CPA.
For sales campaigns, pay closer attention to revenue, conversion rate, and ROI.
Compare Different Channels
Next, compare your advertising channels.
Look at traffic, engagement, conversions, and costs. Then, identify important differences between channels.
For example, one channel may generate inexpensive clicks. Another channel may generate fewer clicks but more qualified leads.
Review Trends Over Time
Do not only review the final campaign numbers. Look at performance over time as well.
Weekly and monthly comparisons can reveal useful trends. You may find that costs increased during a certain period. You may also see that conversions improved after an ad change.
These trends can help you decide what to test next.
Analyze Audience Segments
Audience data can reveal important differences in campaign performance.
Depending on your campaign, you can compare audiences by location, device, age group, interests, or customer type.
However, avoid making major decisions from a very small data sample. Give your data enough time to show a reliable pattern.
Tips for a Better Advertising Report
A strong report should be clear, useful, and easy to scan. The following tips can help.
- Keep the layout simple: Use clear headings and short sections.
- Focus on useful metrics: Include numbers that support your campaign goals.
- Use consistent dates: Compare similar reporting periods.
- Show changes: Compare current results with a previous period when useful.
- Explain important numbers: Add context instead of showing raw data only.
- Use visual summaries: Charts can make complex data easier to understand.
- Include clear recommendations: Tell readers what they can do next.
- Record major changes: Note changes to budgets, audiences, ads, or landing pages.
Common Advertising Campaign Reporting Mistakes
Even a detailed marketing report can fail to provide useful insights. The problem often comes from poor structure or unclear analysis.
Using Too Many Metrics
More data does not always create a better report.
Too many metrics can make the report difficult to read. Instead, select metrics that relate directly to your campaign objectives.
Focusing Only on Clicks
Clicks are useful, but they do not tell the whole story.
A campaign can generate many clicks without generating valuable leads or sales. Therefore, always review clicks alongside conversions and business results.
Ignoring Lead Quality
A high conversion count can look impressive. However, some conversions may have little business value.
When possible, review lead quality and customer value. This gives you a better view of campaign performance.
Ignoring Long-Term Results
Some campaigns aim to create awareness rather than immediate sales.
For these campaigns, short-term sales may not tell the complete story. Consider the original objective when you evaluate results.
Making Recommendations Without Data
Every recommendation should have a clear reason.
For example, do not simply recommend increasing a campaign budget. First, review the channel’s performance, conversion data, costs, and business value.
Advertising Campaign Marketing Report Checklist
Before you share your report, use this checklist:
- Campaign name and reporting period are included.
- Campaign objectives are clearly stated.
- Target audience is identified.
- Advertising channels are listed.
- Campaign budget is included.
- Reach and impressions are reported.
- Clicks and CTR are reported when relevant.
- Conversions are included.
- CPC or CPA is included when relevant.
- Revenue and ROI are included when reliable data is available.
- Channel performance is compared.
- Key findings are explained.
- Recommendations are specific.
- Next steps are clearly defined.
Conclusion
An Advertising Campaign Marketing Report turns advertising data into useful marketing insights. It helps you understand campaign performance, spending, audience response, and business results.
Start with clear campaign goals. Next, select the metrics that matter most. Then, compare your results with those goals and look for meaningful trends.
Finally, turn your findings into practical recommendations. With a consistent reporting process, your team can learn from each campaign and improve future marketing activities.
A clear report does not need to be complicated. It simply needs to show what happened, why it matters, and what you should examine next.