A flowchart is one of the simplest and most effective ways to understand, organize, and communicate a process. Whether you are planning a business workflow, developing software, managing a project, or explaining a complicated procedure, a flowchart can turn complex information into an easy-to-follow visual representation.
Instead of reading long instructions or trying to understand complicated explanations, readers can follow a series of connected shapes and arrows to see how a process works from beginning to end. This makes flowcharts useful for students, professionals, business owners, developers, and anyone who wants to improve their problem-solving skills.
In this guide, you will learn what a flowchart is, how it works, the most common flowchart symbols, different types of diagrams, and practical steps for creating an effective flowchart. You will also discover useful tips and examples to help you build diagrams that are clear, accurate, and easy to understand.
What Is a Flowchart?
A flowchart is a visual diagram that represents the steps, decisions, and sequence of activities within a process. It uses standardized symbols connected by arrows to show how information or tasks move from one stage to another.
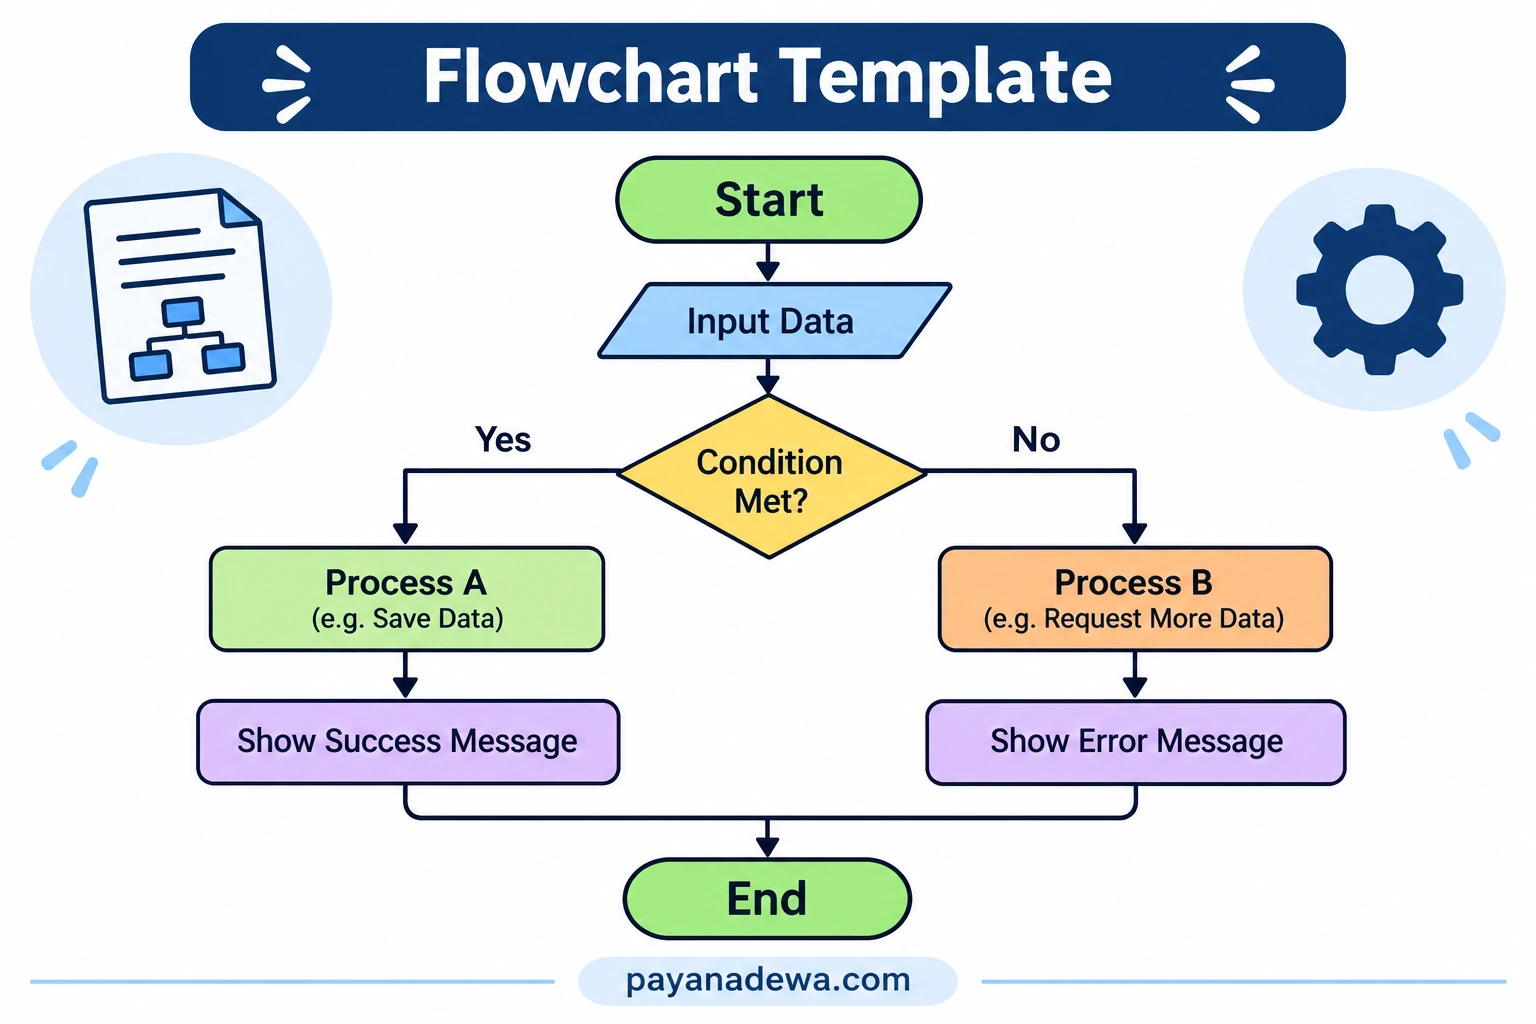
Each symbol has a specific meaning. For example, an oval typically represents the beginning or end of a process, a rectangle represents an activity, and a diamond represents a decision that may lead to different outcomes.
Flowcharts are widely used in business, education, engineering, software development, manufacturing, and project management. They help people understand how a system operates without needing to read lengthy explanations.
A well-designed flowchart should communicate information clearly, show the correct order of activities, and make important decisions easy to identify.
Why Are Flowcharts Important?
Flowcharts offer more than just a visual presentation. They help individuals and organizations understand processes, identify problems, and improve the way work gets done.
1. Make Complex Processes Easier to Understand
Some processes involve multiple steps, departments, or decisions. Explaining them through paragraphs can become confusing. A flowchart simplifies this information by presenting each activity in a logical visual sequence.
2. Improve Communication
Teams often have different interpretations of how a process should work. A flowchart provides a shared visual reference that helps everyone understand their responsibilities and the relationship between tasks.
3. Identify Problems and Bottlenecks
Visualizing a workflow makes it easier to recognize unnecessary steps, repeated activities, delays, and inefficient decision points. Businesses can use these insights to improve productivity.
4. Support Better Decision-Making
Decision symbols show where a process can follow different paths. This allows users to understand possible outcomes and prepare appropriate actions for different situations.
5. Improve Documentation and Training
Organizations can use flowcharts to document standard operating procedures, onboarding instructions, troubleshooting processes, and internal workflows. New employees can understand procedures more quickly when information is presented visually.
Common Flowchart Symbols and Their Meanings
Understanding standard flowchart symbols is essential when creating diagrams. Using the correct shapes helps readers recognize different activities without needing lengthy explanations.
The following are some of the most frequently used symbols in a basic flowchart:
Terminator (Start and End)
The terminator is usually represented by an oval or rounded rectangle. It identifies where a process begins and where it finishes.
Process Symbol
A rectangle represents an action, task, or operation. Examples include calculating a total, saving a document, processing an order, or sending an email.
Decision Symbol
A diamond represents a decision or question. It usually creates two or more possible paths, such as Yes or No, True or False, and Approved or Rejected.
Input and Output Symbol
A parallelogram represents information entering or leaving a process. Examples include entering customer details, receiving data, or displaying a result.
Flowline or Arrow
Arrows connect symbols and indicate the direction of the process. They help readers follow the correct sequence of activities.
Document Symbol
A document symbol represents a document or report generated or used during a process. It is commonly used in administrative and business workflows.
Here is an original printable example illustrating how these symbols work together in a simple process.
Different Types of Flowcharts
There are several types of flowcharts, and each is designed to explain a particular kind of process. Choosing the right format depends on what you want to communicate.
1. Process Flowchart
A process flowchart illustrates the sequence of activities required to complete a particular task. It is commonly used in manufacturing, business operations, and quality management.
2. Workflow Flowchart
A workflow flowchart shows how tasks move between people, teams, or departments. It helps organizations understand responsibilities, approvals, and the movement of work.
3. Data Flowchart
A data flowchart illustrates how information moves through a system. It can show where data originates, how it is processed, and where it is stored or delivered.
4. System Flowchart
A system flowchart describes the overall structure of a computer system or information system. It may include input devices, processing activities, storage components, and output devices.
5. Decision Flowchart
A decision flowchart focuses on questions, conditions, and possible outcomes. It is useful for troubleshooting, evaluating alternatives, and developing step-by-step decision-making procedures.
How to Create a Flowchart Step by Step
Creating a flowchart does not require advanced technical skills. With a clear understanding of your process, you can build a useful diagram by following a few simple steps.
Step 1: Define Your Purpose
Start by identifying what you want your flowchart to explain. Are you documenting a business process, planning a project, explaining software logic, or creating a troubleshooting guide?
A clearly defined objective helps you decide which information should be included and which details can be excluded.
Step 2: Identify All Process Steps
Write down every important activity in the order it occurs. Include starting conditions, required information, actions, decisions, and final outcomes.
Do not worry about the visual design at this stage. Focus on understanding the complete process first.
Step 3: Arrange the Steps in Logical Order
Organize your activities so that the sequence is easy to follow. Most basic flowcharts move from top to bottom or from left to right.
Identify decision points and determine what happens when different conditions are met.
Step 4: Choose the Correct Symbols
Use standard flowchart symbols to represent different activities. For example, use an oval for the start and end, rectangles for processes, diamonds for decisions, and parallelograms for input and output.
Step 5: Connect the Symbols
Draw arrows between the symbols to show the direction of the workflow. Make sure that every decision branch has a clear destination and that the process does not contain confusing connections.
Step 6: Review and Test the Diagram
Follow the flowchart from beginning to end. Check whether every activity is included, each decision has a logical outcome, and the final result matches the intended process.
Ask someone unfamiliar with the process to review the diagram. Their feedback can reveal unclear instructions or missing steps.
Best Practices for Designing an Effective Flowchart
A good flowchart should be easy to read, visually consistent, and accurate. The following tips can help you create professional diagrams.
- Keep it simple: Include only the information necessary to explain the process.
- Use consistent symbols: Follow standard diagram conventions so readers can recognize each activity.
- Maintain a logical direction: Arrange the flow from top to bottom or left to right whenever possible.
- Avoid unnecessary crossing lines: Organize connections to prevent visual confusion.
- Use descriptive labels: Write short, meaningful descriptions inside each symbol.
- Highlight important decisions: Make decision points and their possible outcomes easy to identify.
- Choose readable colors: Use a limited color palette to distinguish different stages without distracting readers.
- Update your diagram: Review the flowchart whenever the actual process changes.
Common Flowchart Mistakes to Avoid
Although creating a flowchart is relatively straightforward, some mistakes can make a diagram difficult to understand.
Using Too Much Information
Adding excessive explanations inside shapes makes a diagram crowded. Keep labels concise and move detailed instructions into supporting documentation when necessary.
Using Incorrect Symbols
Using a decision diamond for an ordinary activity or a process rectangle for a starting point can confuse readers. Learn the standard symbols before building your diagram.
Creating Unclear Decision Paths
Every decision should have clearly labeled outcomes. If a diamond represents a Yes or No question, make sure both branches lead to appropriate next steps.
Ignoring the User’s Perspective
A flowchart should be designed for the people who will use it. Avoid unnecessary technical language when creating diagrams for beginners or general audiences.
Tools You Can Use to Create a Flowchart
Several digital tools make it easier to design, edit, and share flowcharts. The best option depends on your budget, technical requirements, and preferred working style.
- Microsoft Visio: A professional diagramming tool suitable for complex business processes and technical documentation.
- Lucidchart: An online diagramming platform that supports collaborative flowchart creation.
- diagrams.net: A flexible diagramming tool that can be used to create flowcharts and other visual diagrams.
- Canva: A design platform with templates that help beginners create visually appealing diagrams.
- Microsoft PowerPoint: A familiar presentation application that includes shapes and connectors for creating basic flowcharts.
If you only need a simple process diagram, you can also begin with a printable flowchart template and customize the steps according to your requirements.
Practical Examples of Flowcharts in Everyday Life
Flowcharts are not limited to technical or professional environments. They can also help organize everyday activities.
Customer Service Process
A customer service flowchart might begin when a customer submits a complaint. The next step could involve checking the issue, determining whether it can be resolved immediately, and either providing a solution or escalating the case.
Online Shopping Process
An e-commerce flowchart can illustrate the shopping journey, including product selection, adding items to a cart, payment verification, order confirmation, and shipping.
Student Assignment Process
Students can create a flowchart to organize assignments. The process might include selecting a topic, conducting research, writing a draft, reviewing the content, and submitting the final work.
Software Troubleshooting
Technical support teams can use decision flowcharts to guide users through troubleshooting steps. Each answer leads to another action until the problem is identified or escalated.
Conclusion
A flowchart is a practical visual tool for understanding processes, organizing information, and communicating complex procedures. By using standard symbols, logical connections, and clear descriptions, you can transform complicated workflows into diagrams that are easier to understand and follow.
Whether you are a student, business owner, developer, or project manager, learning how to create an effective flowchart can improve productivity and make decision-making more organized.
Start with a simple process, identify its essential steps, select the appropriate symbols, and connect everything in a logical sequence. With practice, you can create professional flowcharts that help people understand ideas and complete tasks more efficiently.